
“You can’t really know where you are going until you know where you have been.”
⁃
-Maya Angelou, American writer, poet, and civil rights activist.
In 2019 the Avenue team became increasingly focused on the high level of government debt in the United States and we sought to understand the likely path forward over the ensuing years for both monetary and fiscal policy given such an environment. We believed the choice of monetary and fiscal policy would ultimately have a large impact on both the level of inflation and interest rates, which would significantly impact asset prices.
At that time, we kept an open mind about what the path ahead would look like. Five years later our view is becoming clearer: investors should expect to be in a prolonged period of higher interest rates with higher levels of inflation.
Understanding that we are in a higher interest rate and higher inflation environment is important for long-term investors because certain types of businesses are better suited to operate in this type of environment. We believe the next several years will demonstrate that certain businesses are clear winners while other businesses will suffer.
The three criteria we have been looking for in our investments are:
1. Businesses that are simple and easy to understand
2. Businesses that can raise prices without decreases in the demand for their product/service.
3. Businesses that do not require large amounts of new capital to be reinvested in their business or external financing.
Combined with making sure we are paying reasonable valuations, this playbook gives us a strong advantage for the years ahead.
Our current portfolio of businesses has had a strong start to 2024 and the investments we have accumulated are well suited for the economic environment we believe lies ahead.
A Core Investment Theme
Our view is that we have entered a prolonged period of much higher fiscal spending by governments. This populist approach to government intervention in the economy has become an unofficial bi-partisan position and is very popular with voters for now. The long-term consequences of these spending policies will not be born by today’s politicians.
There are dangerous long-term consequences to pursuing this kind of policy but as investors we must always accept the world as it is, rather than as we think it should be.
When governments borrow and spend money into the economy it leads to higher demand in the economy than would otherwise exist. This demand push from fiscal spending hits different sectors of the economy at different intervals of time, depending on where the fiscal spending is being directed. For example, if the government borrows and spends money to build a bridge or road then the immediate effect would see more demand for cement, building materials, and skilled trades labour. This has the effect of raising prices for these materials and services.
If the government spends money on one small infrastructure project, it would have a negligible effect on the economy. However, when a government borrows and spends large sums of money it has an outsized effect on economic activity. For context, since the end of 2019 the U.S. government has spent $11.3 trillion in deficit spending, money which has been borrowed and spent into the economy to support economic activity.
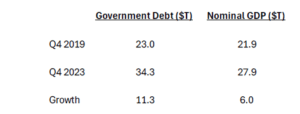
In this same period the economy has grown $6.0 trillion in nominal dollars which is also significant. It is important to understand that this level of nominal growth would not have occurred without the accompanying $11.3 trillion in new debt.
It is hard to overstate the magnitude of this fiscal spending into the economy and the effect it is having on economic activity and corporate profits.
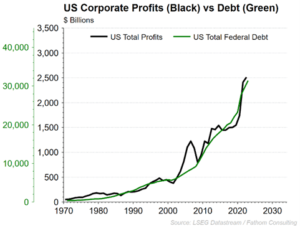
We can see a close relationship between fiscal spending and corporate profits as shown in the chart to the left. When money is borrowed and spent into the economy it can have a significant impact on overall profits in the economy. In fact, we would say this has been the dominant feature of growth in corporate profits over the past five years.
US aggregate corporate profits grew from $1.5 trillion in 2019 to $2.5 trillion by the end of 2022.
This is the fastest growth in corporate profits ever, which is a byproduct of the increased amount of fiscal spending during the same period. We are not venturing to make an argument that this is a good development, we are simply accepting that this is what is happening. As long-term investors, we care about our companies earning higher profits in the future, so we do our best to understand the source of these profits, even at the macro level.
Interest Rates as a Counterbalance
Isaac Newton’s Third Law of Motion states that for every action in nature there is an equal and opposite reaction. So, if object A exerts a force on object B, object B also exerts an equal and opposite force on object A. This law also often holds true for matters surrounding economics and financial markets. If we think of government fiscal spending as Force A, then the counterbalance Force B is interest rates. As the issuance of new bonds rises to fund the growing fiscal deficit this has the effect of pushing interest rates up. Our belief was that the increase in interest rates to 5% during 2022 and 2023 would restrain economic growth and potentially cause an economic slowdown or recession.
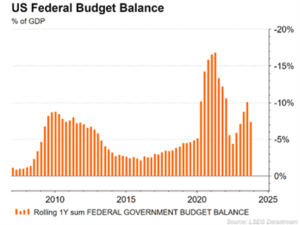
What we did not expect was for government fiscal spending to reaccelerate like it did during 2022 and 2023. The year-over-year deficit once again hit 10% of GDP at the end of 2023, although it has moderated in the past quarter. If this level of government spending were to persist there would be no recession and economic growth would continue to be strong.
With 2024 being an election year the outlook for fiscal spending in 2025 and 2026 remains uncertain. A potentially divided Congress could mean that fiscal spending moderates over the next few years and if so, a bigger decline in economic activity may be in store for 2025. But what about the longer run?
For this analysis we turn to the economic projections of the U.S. CBO (Congressional Budget Office). The CBO is a nonpartisan federal agency that provides budget and economic information to Congress. They have the responsibility of analyzing government budget spending and producing economic summary reports. Since so much of government spending in the US is legally mandated it is relatively straight forward to analyze how government spending will evolve over the next 10 years.
We have summarized the February 2024 projections from the CBO below.
CBO Projections: 2025 -2034
Government Spending: $82.6 trillion
Government Revenue (Taxes): $62.6 trillion
Cumulative Total Deficit: $20.0 trillion
Congressional Budget Office Report, The Budget and Economic Outlook: 2024 to 2034
In the next 10 years the government is expected to spend $82 trillion dollars while it is expected to raise $62 trillion in taxes. If we take these public numbers at face value, it means an additional $20 trillion is going to be borrowed by Congress and spent into the economy. Thus, total federal debt in 2035 will be somewhere between $55-$60 trillion.
If we use the same math as the data on page two and say that each $1 borrowed will lead to an initial $0.50 increase in nominal economic activity, we assume nominal GDP will be close to $40 trillion under this scenario. This number roughly matches the CBO estimate for the size of the economy in 10 years from now.
This level of persistent government spending is going to create further demand within the economy. Therefore, inflation is going to be higher than it otherwise would be. The big question is what interest rates are going to do in response to all the spending. Our belief is that they will be higher, potentially meaningfully so.
When History Rhymes
To bring it back to the eloquent Maya Angelou, as investors we can’t know where we are going unless we understand where we have been. And for us that means understanding the dynamics of the inflation cycle in the 1970s.

Arthur Burns was the Chair of the Federal Reserve from 1970 to 1978. In today’s parlance he is often blamed as being the Fed chair who helped allow inflation to occur. Avenue takes a more nuanced view of his chairmanship as we believe the social and political undercurrents that emerged during the 1960s and 1970s and their fiscal responses were the driving force behind the inflationary cycle. Inflation in the 1970s likely would have occurred regardless of who the Fed chair was because of the underlying social and political conditions in the United States at that time.
Burns’ tenure as Fed chair provides an interesting study for anyone who seeks to understand how much political pressure was levied against the Fed during the 1970s. His professional legacy suffered greatly after his tenure as Fed chair and to this day you will hear market commentators talking about “Jerome Powell not wanting to be the next Arthur Burns”.
After Burns retired from the Federal Reserve, he gave a great speech titled “The Anguish of Central Banking.” This speech provides significant insight.
The speech touches on an often-overlooked aspect of how inflation cycles occur: the underlying social and political conditions of a country prior to the inflation. In the 1970s, Burns argued that a persistent inflationary bias had emerged from the philosophic and political currents that transformed economic life in the United States after the 1930s and 1940s. The Great Depression and World War II created the conditions whereby it became far more politically acceptable, even outright demanded, that the government play a much larger role in the economic life of its citizens. He further added that although many results of this interaction of government and citizen activism with economic policy proved ‘wholesome’, their cumulative effect was to impart a strong inflationary bias to the economy.
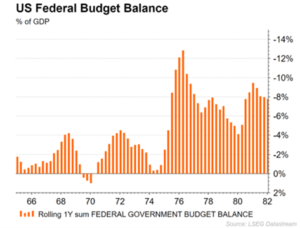
The years of the 1960s and 1970s were a period dominated by Keynesian economic policies which believed that government fiscal policies were responsible for stabilizing and supporting economic activity. The chart on the left shows the fiscal deficit throughout the 1960s and 1970s. The late 1960s and early 1970s saw big increases in government spending. First were the Kennedy tax cuts in 1962-64, then Lyndon Johnson ‘Great Society’ programs from 1965-68, and finally the large increases in military spending under both Johnson and Nixon during the Vietnam War.
To quote Arthur Burns directly:
“The willingness of Government to levy taxes fell distinctly short of its propensity to spend. Since 1970 a deficit has occurred in every year. Budget deficits have thus become a chronic condition of federal finance. They have been incurred when business conditions were poor, and when business conditions were booming. When government runs a budget deficit it pumps more money into the pocketbooks of people than it withdrawals in taxes. The demand for goods and services therefore tend to increase all around.”
The Federal Reserve could have acted early in the 1970s to stem the inflation cycle, but Arthur Burns said the reason it did not was because the Fed was itself caught up in the philosophic and political currents that were transforming American life and culture. Further, as the Federal Reserve kept testing and probing the limits of its freedom to halt the inflation (by raising interest rates), it repeatedly evoked violent criticism from both the President and Congress.
Alan Meltzer, eminent monetary economist and Federal Reserve historian, summarized monetary policy decisions during this time best when he said that the inflation cycle of the 1970s resulted from policy choices that placed more weight on maintaining high employment than on preventing or reducing inflation. This policy choice reflected both political pressures and popular opinion as expressed in election polls.
At Avenue, we see a very similar dynamic occurring today where the governments in both the U.S. and Canada are increasingly focused on trying to support full employment in their economies, rather than being concerned about the potential for a prolonged cycle of inflation. To quote our Canadian Prime Minister in August 2021: “It’s not his job to think about monetary policy.”
Although the initial policy goals in the late 1960s were politically popular, this public sentiment flipped once inflation and interest rates became persistently higher. For the second half of the 1970s fighting inflation became one of the most important objectives for politicians. This manifested in Gerald Ford’s “Whip Inflation Now” (WIN) campaign in the late 1970s. While large fiscal spending programs today seem popular in the short run, the long-term consequences of higher interest rates and higher inflation will produce their own equal and opposite political reaction at some point in the future. In investing and economics there is no free lunch.
How did the Economy & Stocks do during the 1970s?
In the 1970s, nominal economic growth saw a significant boost from all this government spending.
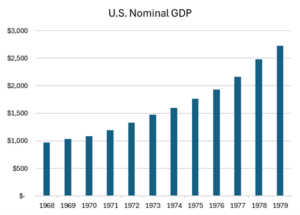
In nominal dollars the U.S. economy grew from $900 billion to $2.7 trillion between 1968 and 1979 which equates to over 10% per year. This was the best decade of nominal economic growth for the United States during the 20th century. A fast-growing nominal economy meant a good backdrop for corporate profits during the 1970s.
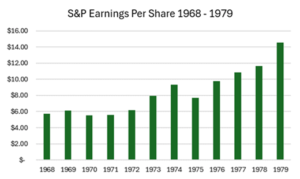
S&P earnings per share grew from below $6.00 to over $14.00 by 1979. This equates to annual earnings growth of almost 9% per year. This occurred even despite two large recessions during the decade. With this backdrop of growing nominal profits, one may expect that the 1970s were years of great returns in the stock market. This was not the case.
Despite a decade of higher nominal economic growth and strong growth in corporate profits, the 1970s was the worst decade for stock market investors since the 1930s. High interest rates and high inflation wreaked havoc on stock prices throughout the decade.
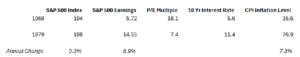
From 1968 to 1979 the S&P 500 was effectively unchanged from a level of 104 to 108. At the same time the level of inflation was 7.3% per year. To relate to what an average investor experienced in the decade imagine a scenario where a portfolio of investments has the same value 10 years from now, but the cost of everything you need to purchase like food, gas, and housing, have all doubled.
Higher interest rates lead to lower stock prices because, among other things, investors are less willing to pay high prices for stocks when they can receive a more attractive rate of return from bonds. High valuation stocks become increasingly risky the longer inflation remains high.
Inflation particularly hurts businesses who require large ongoing investments in tangible assets because the cost of maintaining these tangible assets can rise significantly with inflation. Also, for businesses who are financing large new investments either by issuing new bonds or new equity, this kind of external financing puts significant pressure on their capital structure when interest rates are higher. Finally, businesses who cannot easily raise prices to maintain profit margins are also the big losers during inflation.
Investing through a period of Higher Inflation & Interest Rates
It is our view that the phase shift into a world of higher interest rates and inflation that began in 2020 has the potential to accelerate over the coming years. Although year-over-year inflation has been steadily declining since its initial peak in 2022, we are observing behaviour from governments suggesting they are itching at the trigger to spend even more money into the economy. If our current economy gets hit with more fiscal stimulus it creates the conditions for another surge in inflation in the next few years. At that point a bigger inflation cycle will already be well underway.
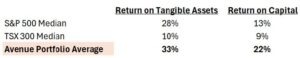
For long term investors it is important to build an investment portfolio with companies who can navigate through this kind of environment. Analyzing the different sectors of the stock market provides clues to the average investor about which types of businesses are better suited for a higher interest rate and inflation environment. Businesses who earn higher returns on capital and higher returns on tangible assets are more likely to generate economic wealth for shareholders. Businesses who regularly score high on these metrics generally have good pricing power, have low ongoing capital expenditure needs, and have lower amounts of debt.
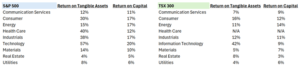
Note: We have excluded Financials for both Indexes because these accounting metrics don’t apply to that sector. We have also excluded Health care from Canada to exclude the unprofitable marijuana companies listed in Canada.
The above table provides some logical observations. Asset heavy businesses who employ high levels of debt, are unable to raise prices, and are exposed to cost inflation, do not generate high levels of profits on the capital they have employed in their businesses. This means less profits to reinvest in their business or distribute to shareholders.
Our investment process focuses on finding companies who can reinvest their profits into their business while also returning excess profits to us through share repurchases or dividends. At the end of March 2024, our equity portfolio has an average return on tangible assets and return on capital greater than the North American Indices. We built this portfolio while also maintaining attractive valuations on our investments.
To conclude, it is important for investors to understand the impact that a prolonged period of higher interest rates and inflation can have on an equity portfolio. To succeed as an investor in this market Avenue needs to ensure that we own the right businesses with the correct economic characteristics.
We continue to be on the lookout for new investments that satisfy this approach to investing.
Bryden Teich
April, 2024